Installation and Update Guide
This guide covers the 1.9.4 browser-extension package, including installation, update steps, user consent prompts, basic help, collection scope, and privacy redaction notes.
What You Need
- The extracted Vista Tech Support Monitor package folder.
- Google Chrome or another Chromium-based browser that supports unpacked extensions.
- The intake API URL, enrollment key, Group ID, machine label, and account pseudonym salt from your administrator.
Install The Extension
- Extract the ZIP to a normal folder such as C:\VistaTechSupportMonitor.
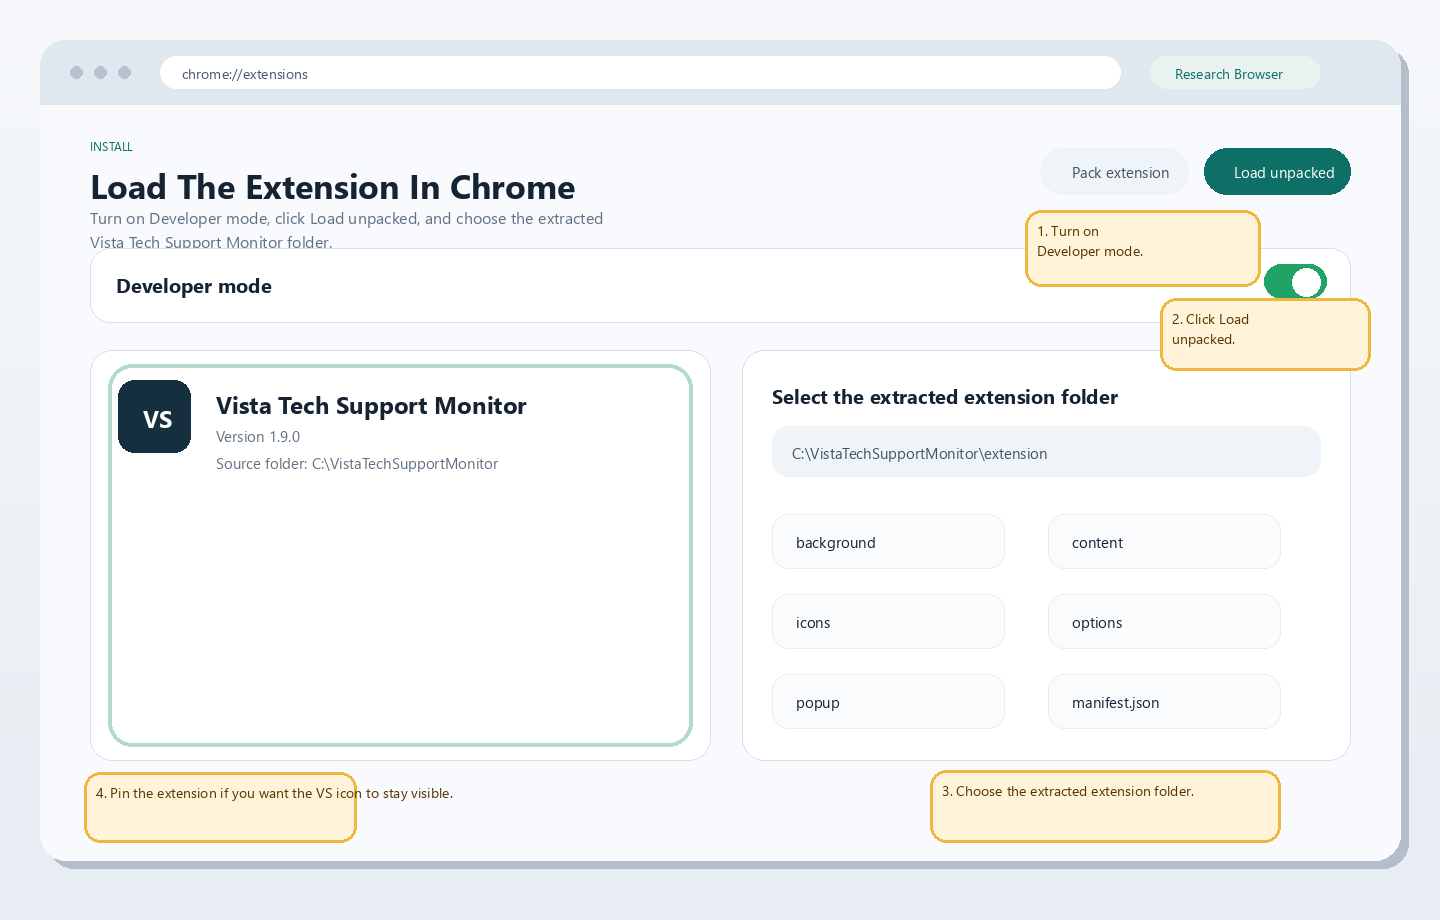
- Open Chrome and go to chrome://extensions.
- Turn on Developer mode.
- Click Load unpacked.
- Choose the extracted extension folder.
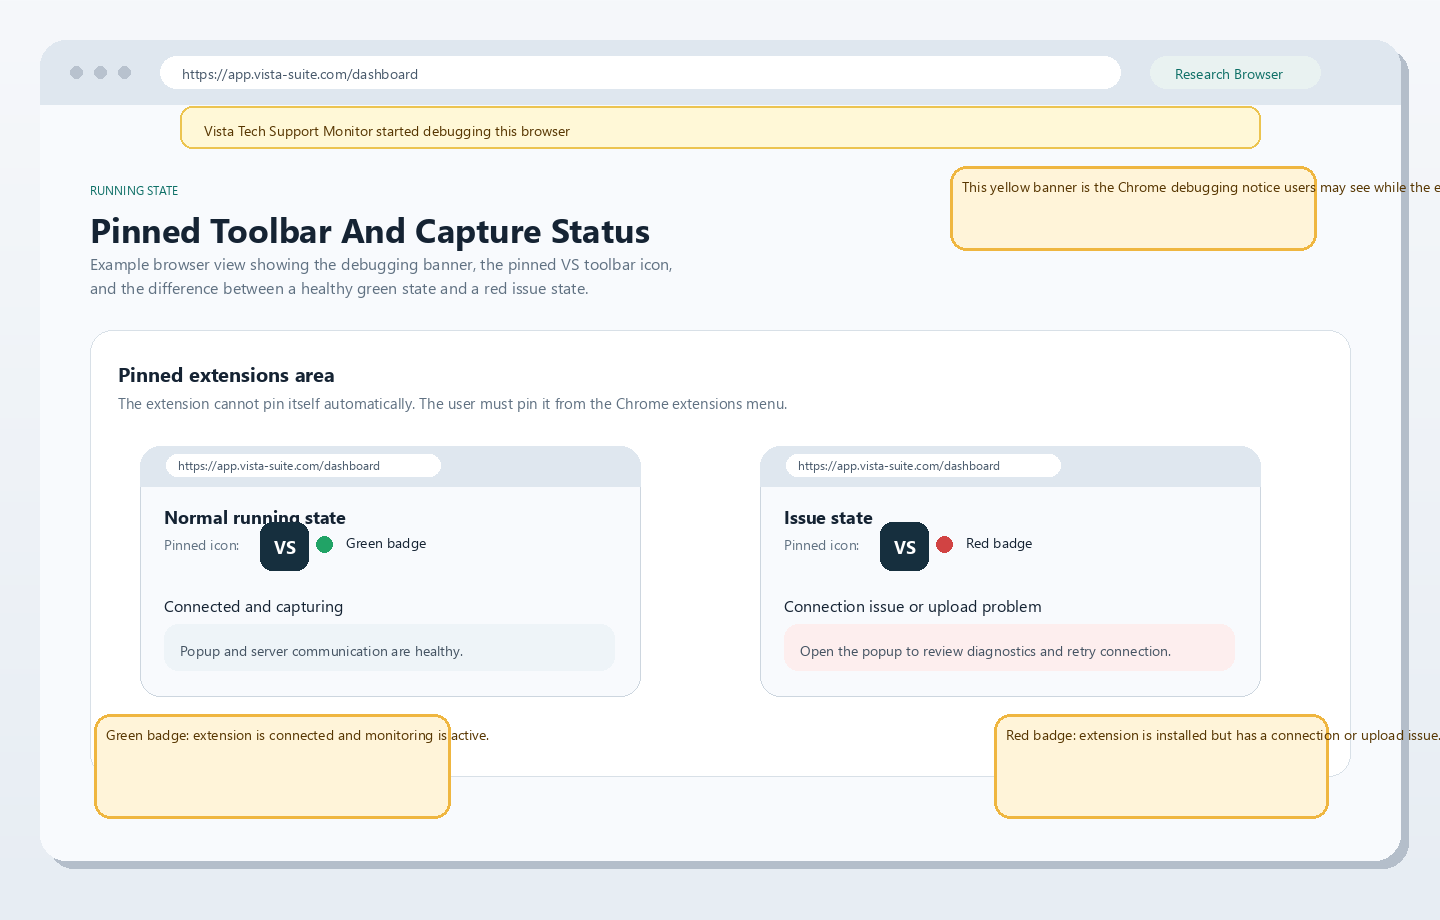
- Pin Vista Tech Support Monitor from the Chrome extensions menu if you want the VS toolbar icon to stay visible.
Configure And Acknowledge
- Open the Vista Tech Support Monitor toolbar popup.
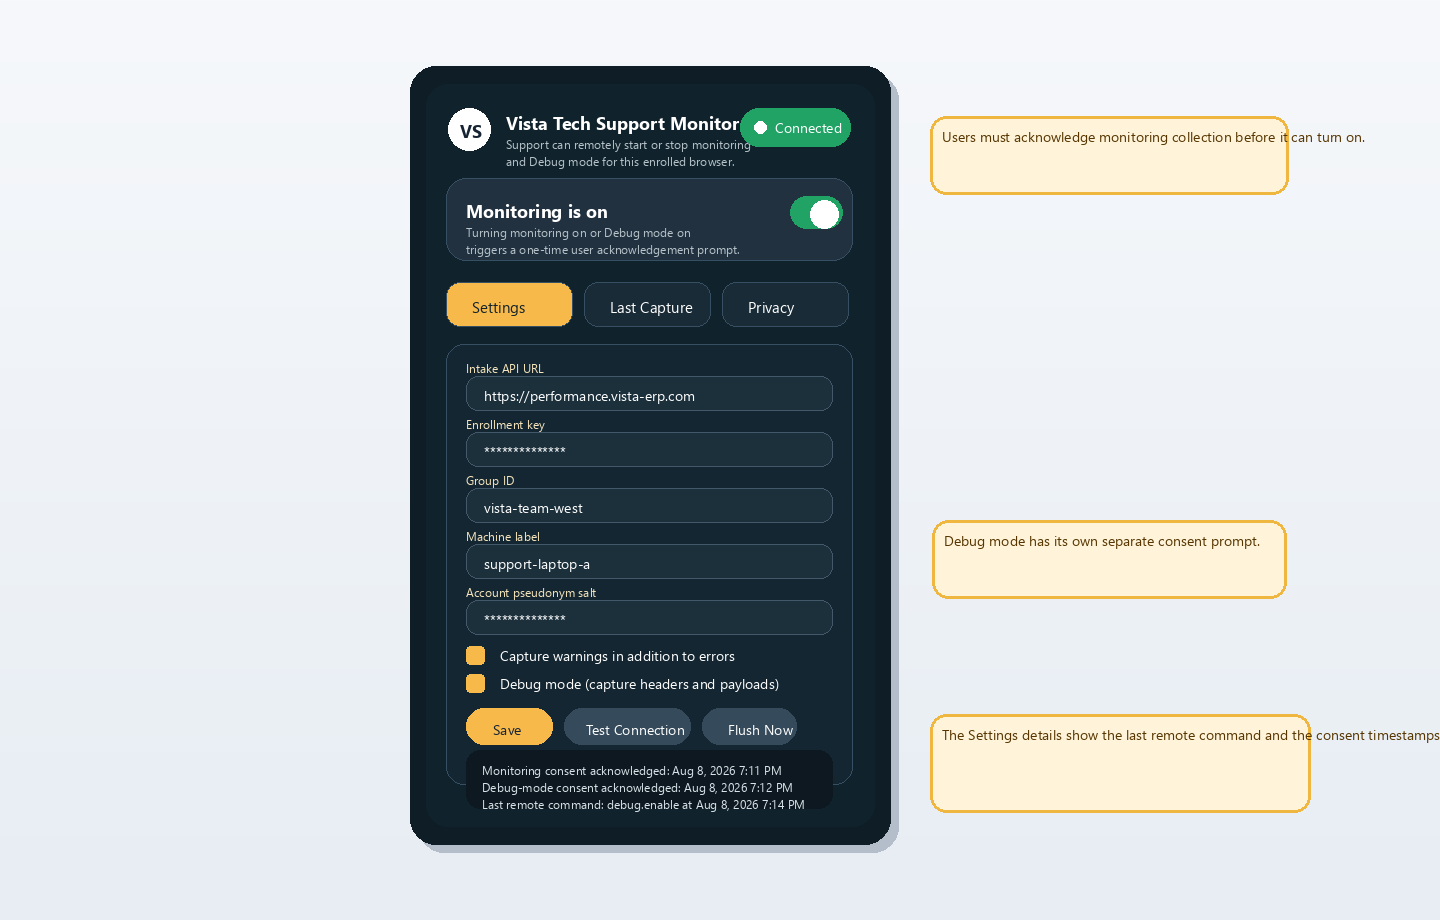
- On the Settings tab, enter the intake API URL, enrollment key, Group ID, machine label, and account pseudonym salt.
- Click Save, then Test Connection.
The first time a browser user turns monitoring on, the extension asks that user to acknowledge collection before monitoring starts. Debug mode asks for a separate acknowledgement because it captures additional redacted request and response detail.
Update An Existing Install
- Close Chrome tabs that are actively using Vista Suite or Vista Quote.
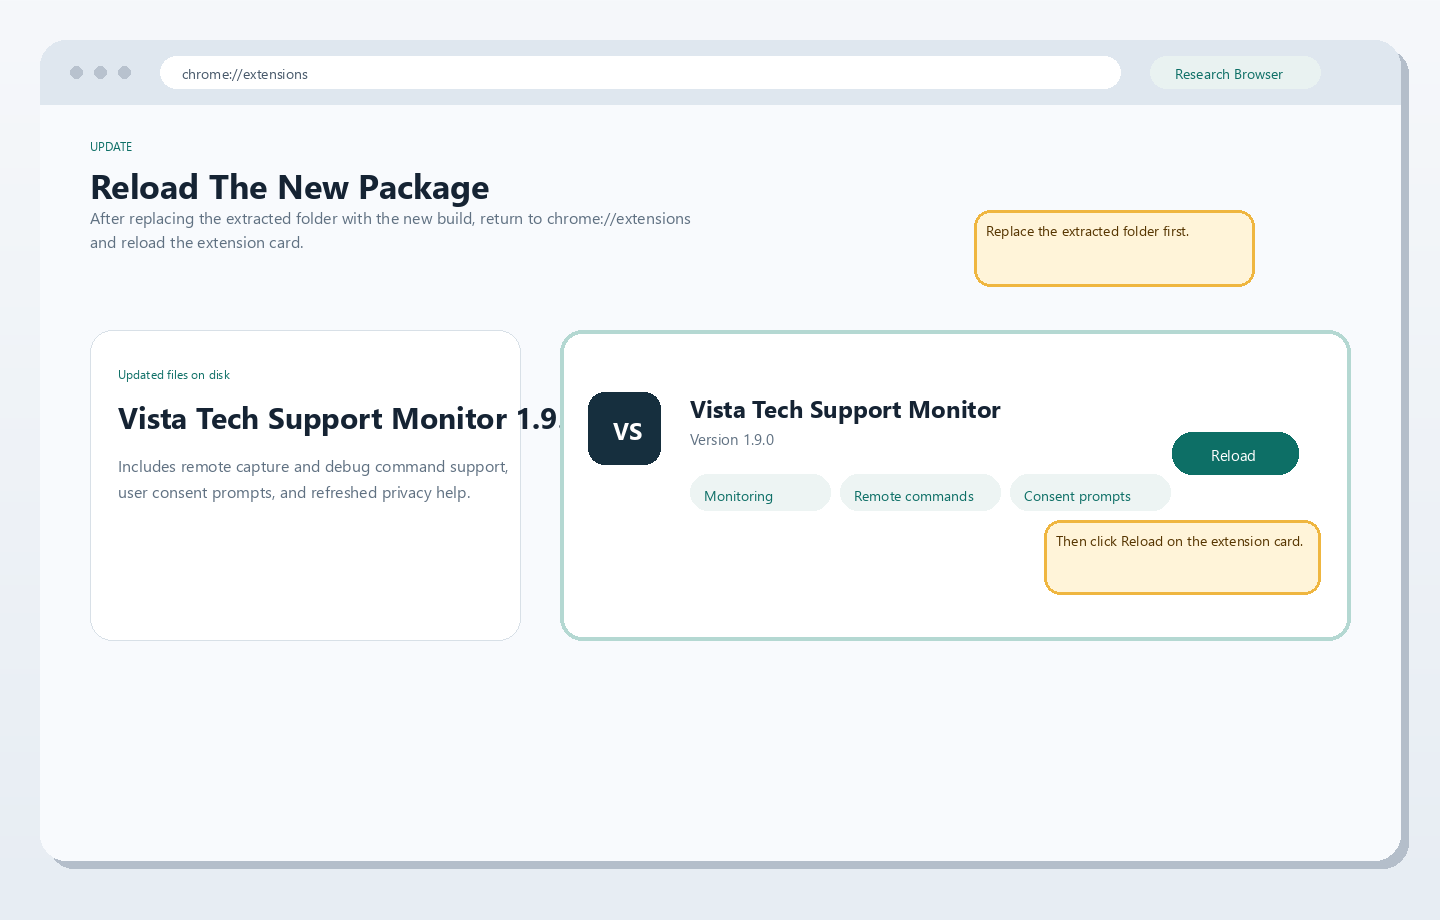
- Replace the extracted extension folder with the new 1.9.4 files.
- Return to chrome://extensions.
- Click Reload on the Vista Tech Support Monitor card.
Basic Help
Save And Test
Use Save after changing settings. Use Test Connection when entering or replacing the enrollment key so the browser can mint or refresh its per-install token.
Flush Now
Use Flush Now when support wants queued session data uploaded immediately instead of waiting for the normal background flush.
Debug Mode
Turn on Debug mode only when support asks for deeper troubleshooting detail. The first enablement in a browser profile requires a separate acknowledgement.
Privacy Tab
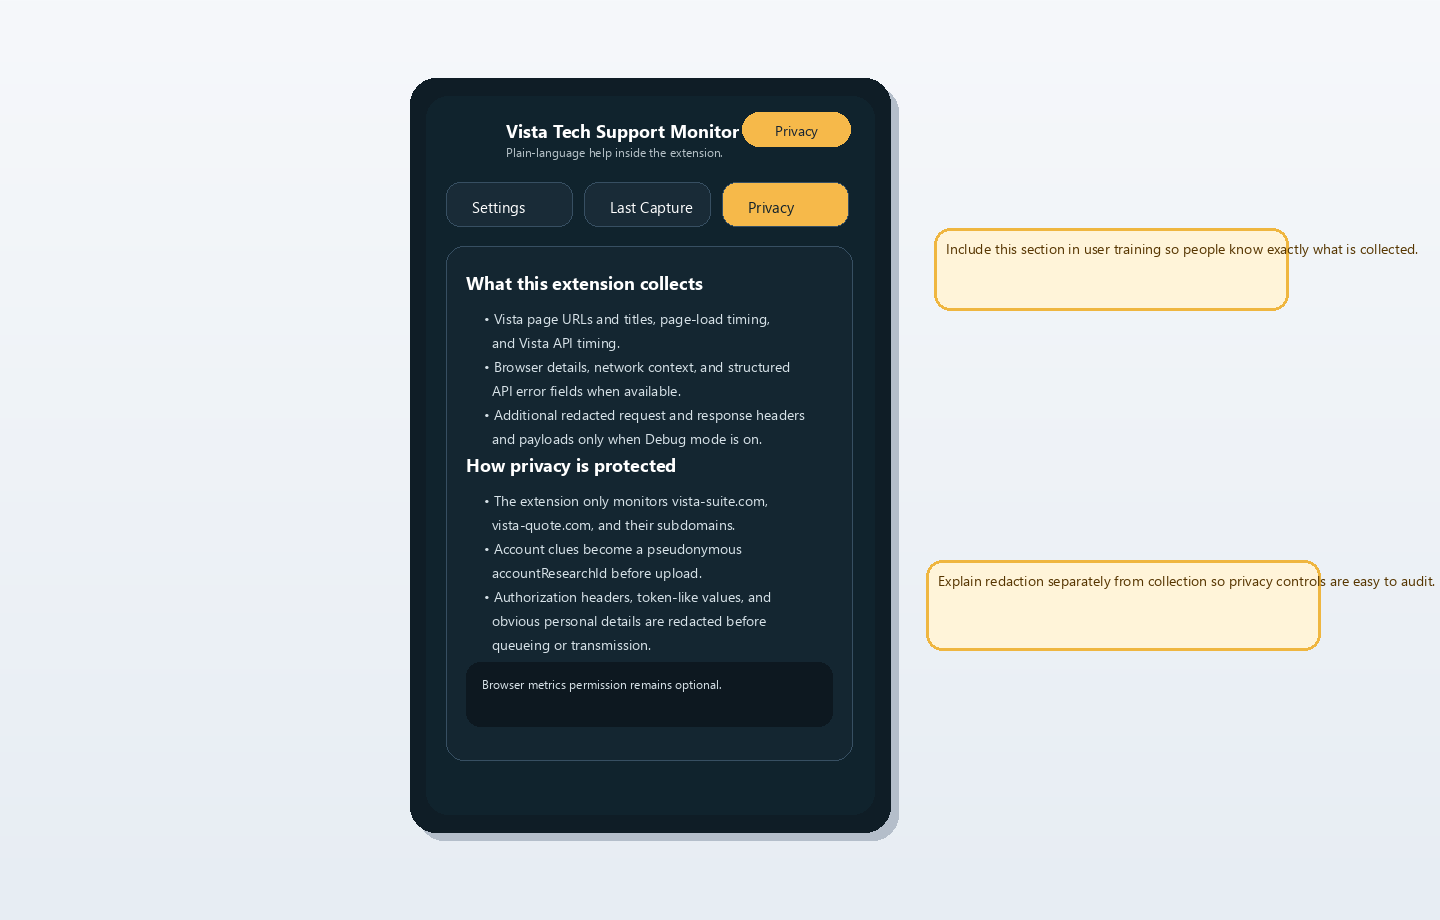
The popup Privacy tab gives end users a plain-language explanation of collection scope and privacy protections.
Pinning And Browser Status
- Pin the extension from the Chrome extensions menu if you want the VS icon to stay visible in the toolbar.
- A green badge means the extension is connected and monitoring is active.
- A red badge means the extension is installed but has a connection, token, or upload problem that needs attention.
- While active debugging is attached, Chrome may show a banner saying Vista Tech Support Monitor started debugging this browser.
- The extension cannot automatically pin itself. The user must do that manually in Chrome.
What The Extension Collects
- Vista page URLs and titles, page-load timing, and Vista API timing across vista-suite.com and vista-quote.com.
- Detailed request timing when Chrome exposes it, including redirect hops, protocol hints, transfer-size hints, cache flags, and request/response timing phases.
- Structured troubleshooting fields when available, such as trace IDs, request IDs, correlation headers, Server-Timing, app metadata, client network context, and structured API error details.
- Browser environment context such as browser type, version, operating system, open tab count, open window count, and a capture timestamp.
- Browser CPU and memory totals only when the browser exposes the required API and the optional browser-metrics permission is granted.
- Browser console errors and, when enabled, warning events from Vista pages.
- Additional redacted request headers, response headers, request payloads, and response payloads only when Debug mode is enabled.
- Remote-command status metadata such as the last command applied, the last failed command reason, pending acknowledgement count, and local consent timestamps.
- A pseudonymous accountResearchId derived in the browser instead of using raw email addresses as the central research identifier.
What Stays Local
- Operator settings such as the intake API URL, per-install token, Group ID, machine label, pseudonym salt, warning/debug preferences, and consent timestamps.
- Remote-command state such as the last applied or failed command and any acknowledgement retry state.
- Session-only telemetry queues, connection state, and the last-capture preview for the current browser session.
- No growing permanent local telemetry database or rolling disk log.
Privacy Redaction
This section is intentionally separate from “What The Extension Collects” so the collection scope and the privacy controls can be reviewed independently.
- Authorization headers and other token-like header values are redacted before telemetry is queued or uploaded.
- Token-like URL parameters and sensitive text fragments are redacted from captured URLs and text payloads before transmission.
- Account clues are converted into a pseudonymous accountResearchId inside the browser before upload.
- Raw email addresses are not used as the central account research identifier.
- Monitoring stays limited to vista-suite.com, vista-quote.com, and their subdomains.
- Turning monitoring off clears the queued session data.
Remote Troubleshooting Controls
- The server can send capture.start, capture.stop, debug.enable, and debug.disable commands to an enrolled browser install.
- The extension polls for commands on a schedule, polls again after successful ingest or enrollment activity, and retries acknowledgements safely.
- Remote capture.start requires prior monitoring acknowledgement in that browser profile.
- Remote debug.enable requires prior Debug acknowledgement in that browser profile.
- The popup diagnostics show the latest remote result, the latest failure reason, and pending acknowledgement count.
Remove The Extension
- Open chrome://extensions.
- Find Vista Tech Support Monitor.
- Click Remove and confirm the removal in Chrome.
Removing the extension stops monitoring, removes the toolbar icon, and deletes the extension's local settings and session data from that browser profile.
Troubleshooting
- If Save is blocked, confirm that Group ID, machine label, and pseudonym salt are filled in.
- If Test Connection fails, confirm the API URL and enrollment key, then review the popup diagnostics.
- If remote capture.start or debug.enable does not activate, check whether the user has already acknowledged that consent prompt in the current browser profile.
- If browser CPU and memory remain unavailable, the browser may not expose the required API or the optional permission may not have been granted.